
















Time-in-range diabetes data has shifted how clinicians think about glycemic control, and if you use a continuous glucose monitor, you’ve likely seen it on your reports already. Understanding time-in-range vs.
A1C matters because A1C limitations are real: it reflects a 2–3 month average that hides blood sugar variability, hypoglycemia (low blood glucose episodes), and glucose spikes. TIR (time-in-range) captures those daily patterns. The ADA now recommends TIR as a key metric alongside A1C in clinical diabetes care, and the reasons are clinically compelling.
Here’s the frustration many people with diabetes share: your A1C looks controlled at your checkup, yet you’re still riding a daily rollercoaster of highs and lows that A1C simply doesn’t capture. This article explains what TIR is, how it complements A1C, what the current evidence shows, and how to use it to guide more personalized management.
- Time-in-Range measures the percentage of time blood glucose stays within a target range, giving a more detailed picture of daily diabetes control than A1C alone.
- International consensus guidelines recommend a TIR target of at least 70% for most adults with Type 1 or Type 2 diabetes, based on associations with reduced complication risk.
- A1C and TIR measure different things; both matter. Use TIR to understand daily patterns and A1C to assess long-term average glucose trends.
Read More: Diabetes Burnout: What It Is, Why It Happens, and How to Overcome It
What Is Time-in-Range (TIR) in Diabetes?
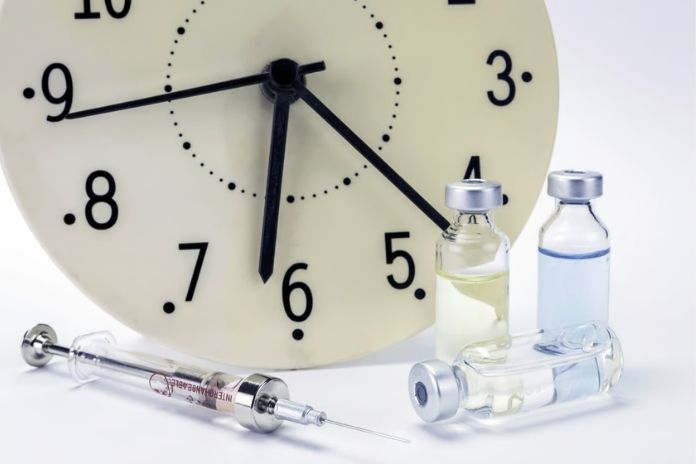
How Time-in-Range Is Measured
Time-in-Range (TIR, the percentage of time blood glucose stays within a clinically defined target window) is calculated from CGM (continuous glucose monitor, a wearable sensor tracking glucose every 1–5 minutes throughout the day and night) data.
The standard target for most adults with diabetes is 70–180 mg/dL (milligrams per deciliter). CGM sensors capture hundreds of readings daily, making TIR far more granular than periodic A1C testing or single fingerstick checks.
What TIR Percentages Actually Mean
A TIR of 70% means your glucose stays within the 70–180 mg/dL window for about 16.8 hours out of every 24. To put this concretely: improving TIR by just 5 percentage points adds roughly 72 minutes per day within a safe glucose range. Research shows that each 10% improvement in TIR is associated with meaningful reductions in the risk of diabetic complications.
Why Does TIR Provide a More Detailed Picture Than Single Glucose Checks
A single fingerstick reading is a snapshot. TIR is the full film capturing glucose trajectory after meals, through the night, during exercise, and during stress. Studies confirm that CGM-derived TIR reflects real-world glucose patterns that neither A1C nor isolated checks can adequately capture.
What Is A1C and What Does It Measure?

How the A1C Test Reflects Average Blood Sugar Over Time
A1C (glycated hemoglobin, a blood test measuring the percentage of hemoglobin molecules with glucose attached) reflects average blood glucose over the preceding 2–3 months. A result of 7% roughly corresponds to an average glucose of 154 mg/dL. The CDC identifies an A1C below 7% as the general target for most non-pregnant adults with diabetes, though individual targets vary based on age and risk.
Why A1C Has Been a Standard Diabetes Marker For Years
A1C’s clinical longevity reflects its track record. Long-term studies established clear links between A1C and risk of diabetic retinopathy (eye disease from blood vessel damage), nephropathy (kidney disease), and neuropathy (nerve damage).
It requires only a standard blood draw, no wearable technology, and provides a reproducible, long-term overview. The landmark DCCT trial demonstrated that intensive A1C reduction significantly lowered complication rates in Type 1 diabetes.
Limitations of A1C Testing
Two people can produce identical A1C values of 7.5% with completely different daily glucose profiles: one with stable near-target glucose and another with frequent severe lows offset by prolonged highs.
Research confirms that A1C cannot distinguish glucose variability from stable control a gap with direct clinical implications. Conditions affecting red blood cell lifespan, including sickle cell trait and iron-deficiency anemia, also distort A1C readings.
Why Time-in-Range May Matter More for Daily Diabetes Management
TIR Shows Blood Sugar Fluctuations in Real Life
Real life doesn’t happen in a clinic. Meals, exercise, stress, and poor sleep all shift glucose in ways that show up only in continuous data. A person with Type 1 diabetes who boluses precisely for dinner but spikes overnight due to a high-fat meal or drops low during a morning run accumulates time out of range that never surfaces in their A1C.
CGM data demonstrates that nocturnal hypoglycemia, largely invisible without continuous monitoring, contributes to overall time below range.
How Two People Can Share the Same A1C But Have Very Different Glucose Patterns
An A1C of 7.2% in one person reflects steady glucose around 160 mg/dL throughout the day. In another, the same 7.2% reflects glucose swinging from 55 mg/dL at 3 a.m. to 280 mg/dL after breakfast, averaging out identically.
The symptom burden and complication risk in these two people are not equivalent. High glucose variability independently associates with cardiovascular risk and worsened quality of life regardless of A1C level.
What Research Suggests About TIR and Diabetes Complications
As Dr. Thomas Danne, chair of the International Diabetes Federation’s technology working group, department of general pediatrics endocrinology/diabetology, “Auf der Bult” hospital, hannover, germany, and lead author of the International TIR consensus guidelines, explains in the 2019 consensus paper, “Time in range provides a simple, intuitive metric that complements A1C and helps both clinicians and patients understand glucose control in meaningful, actionable terms.”
Studies in Type 1 diabetes link higher TIR to lower rates of retinopathy and nephropathy. Evidence in Type 2 diabetes continues to develop with consistent signals toward cardiovascular and microvascular benefit.
Understanding Target Time-in-Range Goals for Diabetes
TIR targets aren’t universal; they reflect diabetes type, age, and individual risk profile. The international consensus statement recommends specific thresholds by patient group, with the general adult target at greater than 70% in the 70–180 mg/dL range.
Diabetes Management
Understanding Target Time-in-Range Goals
| Patient Group | TIR Target (70–180 mg/dL) | Time Below Range | Time Above Range |
|---|---|---|---|
| 🩸 Type 1 diabetes | >70% (>16.8 hrs/day) | <4% (<58 min/day) | <25% |
| 💊 Type 2 diabetes | >70% (>16.8 hrs/day) | <1% (<14 min/day) | <25% |
| 🤰 Pregnancy (T1D) | >70% (63–140 mg/dL) | <4% | <25% |
| 🧓 Older adults / high risk | >50% (more flexible) | <1% | <10% >250 mg/dL |
Pregnancy with Type 1 diabetes uses a tighter range (63–140 mg/dL) because fetal health is associated closely with maternal glucose control throughout gestation. Older adults and those at high risk of hypoglycemia use more flexible targets to prioritize safety.
How Continuous Glucose Monitors Changed Diabetes Management
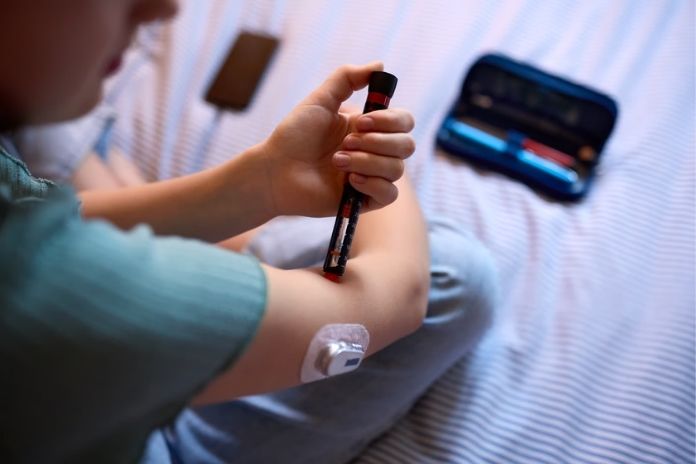
What CGMs Track and Why Glucose Trends Matter for Diabetes
CGMs show direction and rate of change, not just a number. A glucose reading of 130 mg/dL trending rapidly downward carries a very different implication than the same reading trending stable.
CGM technology enables real-time alerts for impending hypoglycemia before symptoms develop, significantly reducing severe low episodes in people with type 1 diabetes. Identifying patterns, post-meal spikes, and overnight lows on exercise days drives meaningful management changes.
Challenges and Limitations of CGM Technology
CGMs carry real-world limitations. Sensor accuracy varies near the lower glucose range. Cost and insurance coverage remain barriers across the US, UK, and Australia. Research documents that some patients experience data overload from continuous readings, increasing anxiety without improving outcomes when used without structured support.
Education on interpreting CGM data matters as much as the technology itself.
Read More: Diabetes and Dementia: What the Latest Research Reveals About the Connection
Practical Ways to Improve Time-in-Range
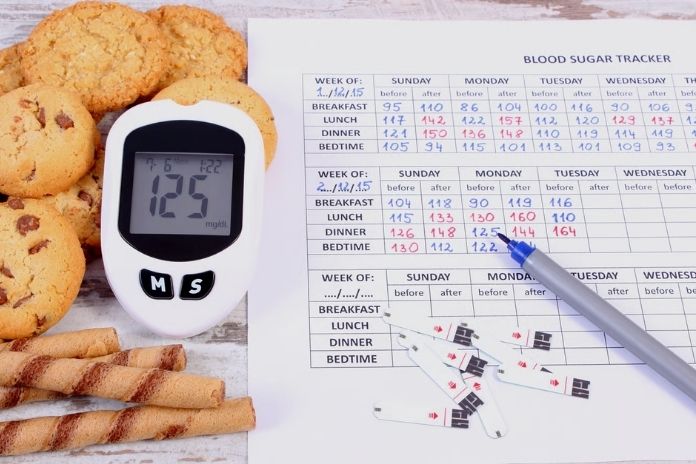
Consistent adjustments produce real TIR improvements. None of these requires perfection:
Review Post-Meal Glucose Response: Check CGM data 1–2 hours after eating to identify which foods consistently push glucose above range. Adjusting carbohydrate timing produces sustainable improvements.
Time Physical Activity Strategically: Exercise improves TIR by increasing insulin sensitivity and reducing post-meal glucose excursions. Late-evening aerobic exercise can contribute to overnight hypoglycemia in insulin users; discuss timing adjustments with your care team.
Review Medication and Insulin Timing: Mealtime insulin taken too late, mismatched basal doses, and inconsistent oral medication timing all reduce TIR. Bring CGM reports to every appointment for data-driven dose reviews.
Address Sleep and Stress: Poor sleep quality independently raises fasting glucose and reduces insulin sensitivity the following day. Both sleep and stress are modifiable with structured behavioral approaches.
As Dr. Irl Hirsch, professor of medicine at the University of Washington Medical Center and a leading CGM researcher, explains in his clinical research on CGM use, “The goal of CGM isn’t to create more numbers to worry about. It’s to give patients and clinicians the information needed to make better, safer decisions. TIR makes that conversation concrete.”
When to Talk to a Healthcare Provider About Time-in-Range
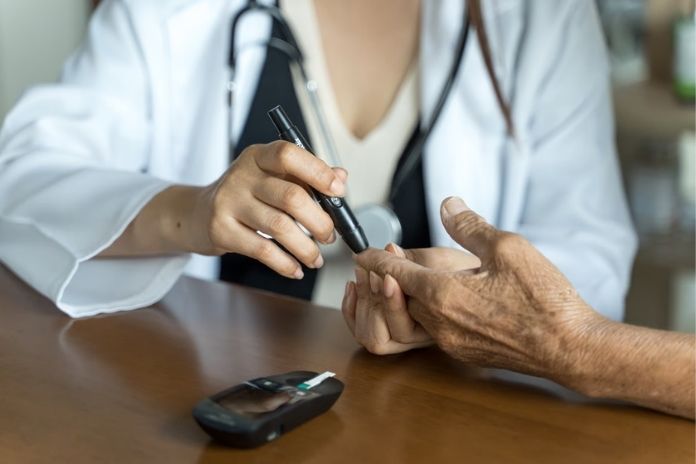
Seek a targeted conversation with your care team if your TIR consistently falls below 50%, you experience unexplained frequent hypoglycemia, or your A1C and TIR appear misaligned. Clinical guidelines recommend reviewing CGM-derived TIR at every diabetes care visit for people using CGM technology.
Ask specifically about your individual TIR goal, what proportion of out-of-range time falls below versus above target, and whether your current treatment addresses the dominant driver. Data-driven appointments produce more useful adjustments than symptom-only discussions.
Read More: Glycemic Index vs. Glycemic Load: What People With Diabetes Really Need to Know
Final Word
A1C told us where we’d been. TIR tells us what’s happening right now through meals, sleep, stress, and exercise. Neither number is the whole story on its own. Together, they give you and your care team the clearest picture of your glucose health. More data, used thoughtfully, means more informed decisions and better outcomes over time. Every hour in range counts.
- A1C remains a valuable long-term marker, but it doesn’t capture the daily glucose swings that affect how you feel and your risk of complications. Time-in-Range fills that gap.
- TIR is not a perfection score. Every additional hour in range carries clinical value. Even small improvements in glucose stability support better long-term outcomes.
- Review your TIR data with your healthcare provider at every diabetes appointment. Ask about your individual TIR target, what drives time out of range, and how to address it safely.
FAQs About Time-in-Range Diabetes
1. My A1C is fine, but my blood sugar swings wildly. Does time-in-range matter more?
Yes, this is exactly what TIR addresses. High glucose variability independently associates with increased complication risk even when A1C appears controlled. TIR reveals the swings A1C masks. Discuss your CGM patterns at your next diabetes appointment.
2. What is time in range for diabetes, and how is it different from A1C?
Time in range measures the percentage of time blood glucose stays between 70 and 180 mg/dL, captured continuously by CGM. A1C reflects a 2–3 month average without showing daily variability or extremes. Both metrics provide distinct and complementary clinical information.
3. What is a good time-in-range target for someone with Type 2 diabetes?
International consensus guidelines recommend greater than 70% TIR in the 70–180 mg/dL range for most adults with Type 2 diabetes, with less than 1% time below 70 mg/dL. Individual targets depend on age, hypoglycemia risk, and overall clinical circumstances.
4. Can you improve time-in-range without using a CGM?
Dietary, exercise, and medication adjustments improve glucose control, but measuring TIR specifically requires a CGM. CGM use consistently produces greater TIR improvement than fingerstick-only monitoring across multiple clinical trials. Ask your provider about CGM access and insurance coverage options.
5. Does improving time-in-range actually reduce diabetes complications?
Studies show higher TIR associates with lower rates of retinopathy and nephropathy in Type 1 diabetes. Evidence in type 2 diabetes continues to build. Each 10% TIR improvement carries meaningful clinical significance for long-term complication risk reduction.
References
- Battelino, T., Danne, T., Bergenstal, R. M., Amiel, S. A., Beck, R., Biester, T., Bosi, E., & Buckingham, B. A. (2019). Clinical targets for continuous glucose monitoring data interpretation: Recommendations from the international consensus on time in range. Diabetes Care, 42(8), 1593–1603.
- American Diabetes Association Professional Practice Committee. (2023). Standards of care in diabetes: 7. Diabetes technology. Diabetes Care, 46(Supplement 1), S111–S127.
- Lu, J., Ma, X., Zhou, J., Zhang, L., Mo, Y., Ying, L., Lu, W., Zhu, W., Bao, Y., Vigersky, R. A., & Jia, W. (2018). Association of time in range, as assessed by continuous glucose monitoring, with diabetic retinopathy in type 2 diabetes. Diabetes Care, 41(11), 2370–2376.
- National Academies of Sciences, Engineering, and Medicine. (2020). Temporomandibular disorders: Priorities for research and care. National Academies Press.
- Centers for Disease Control and Prevention. (2024). Managing blood sugar: A1C.
- Beck, R. W., Bergenstal, R. M., Riddlesworth, T. D., Kollman, C., Li, Z., Brown, A. S., & Close, K. L. (2019). Validation of time in range as an outcome measure for diabetes clinical trials. Diabetes Care, 42(3), 400–405.
- NHS. (2023). Continuous glucose monitors and flash glucose monitors. National Health Service.
- Moser, O., Riddell, M. C., Eckstein, M. L., Adolfsson, P., Rabasa-Lhoret, R., van den Boom, L., Gillard, P., Nørgaard, K., Oliver, N. S., Zaharieva, D. P., Battelino, T., de Beaufort, C., Bergenstal, R. M., Buckingham, B., Cengiz, E., Deeb, A., Heise, T., Heller, S., Kowalski, A. J., … Mader, J. K. (2020). Glucose management for exercise using continuous glucose monitoring (CGM) and intermittently scanned CGM (isCGM) systems in type 1 diabetes: Position statement of the European Association for the Study of Diabetes (EASD) and of the International Society for Pediatric and Adolescent Diabetes (ISPAD) endorsed by JDRF and supported by the American Diabetes Association (ADA). Pediatric Diabetes, 21(8), 1375–1393.
- Agiostratidou, G., Anhalt, H., Ball, D., Blonde, L., Gourgari, E., Harriman, K. N., Kowalski, A. J., Madden, P., McAuliffe-Fogarty, A. H., McElwee-Malloy, M., Peters, A., Raman, S., Reifschneider, K., Rubin, K., & Weinzimer, S. A. (2017). Standardizing clinically meaningful outcome measures beyond HbA1c for type 1 diabetes: A consensus report of the American Association of Clinical Endocrinologists, the American Association of Diabetes Educators, the American Diabetes Association, the Endocrine Society, JDRF International, The Leona M. and Harry B. Helmsley Charitable Trust, the Pediatric Endocrine Society, and the T1D Exchange. Diabetes Care, 40(12), 1622–1630.
In this Article