

")


")

")
")
 Charting")
Conceiving can be like solving a puzzle. Most couples believe that having regular cycles is just like getting it right in terms of timing intercourse, but in truth, only a few days in each cycle are fertile. The problem is finding them. This is where basal body temperature charting enters the picture.
Your basal body temperature (BBT) is the lowest temperature your body reaches during complete rest, usually right after waking up. By tracking these subtle shifts with a BBT thermometer, women can pinpoint when ovulation has occurred and gain clearer insights into their fertile window. This practice is one of the fertility awareness methods, a natural, non-invasive approach to understanding reproductive health.
In contrast to blood work or ultrasound, BBT charting is easy, inexpensive, and empowering; it just requires patience and consistency. Over time, it can reveal trends regarding ovulation, luteal phase duration, and even early signs of BBT pregnancy.
In this article, we will understand how BBT changes and how it helps you realise that you’re fertile.
Read More: How to Track Ovulation Accurately (Even With Irregular Cycles)
What Is Basal Body Temperature (BBT)?
Basal body temperature refers to the lowest body temperature reached while you relax, typically after waking and before any activity. According to studies, BBT is a valid biological marker that is affected by changes in the hormones of the menstrual cycle.
- BBT compared to average body temperature: Body temperature varies throughout the day with activity, food intake, and environment. BBT, on the other hand, is recorded under identical conditions, which allows it to be sensitive enough to pick up on minor hormonal changes.
- Hormonal connection: Estrogen controls the first half of the cycle, maintaining body temperatures slightly lower until ovulation. Progesterone produced by the corpus luteum increases BBT by around 4–1.0°F (0.2–0.6°C) after ovulation. This increase is maintained throughout the luteal phase.
Why it matters: These shifts present a consistent method to determine ovulation retrospectively, allowing women to identify their most fertile days.
How BBT Shifts Throughout the Menstrual Cycle

Your cycle is not simply “before and after your period.” BBT changes reflect the hormonal narrative occurring throughout three primary stages:
a. Follicular Phase (Before Ovulation): In the follicular phase, which starts with menstruation and closes with ovulation, estrogen levels are elevated, maintaining BBT low and constant. Most women measure temperatures ranging from 97.0–97.7°F (36.1–36.5°C).
b. Around Ovulation: A few days before ovulation, a few women experience a slight fall in temperature. This is followed by a continued rise of approximately 0.4–1.0°F. This rise is the indication that ovulation has taken place, releasing an egg that lasts for 12–24 hours.
c. Luteal Phase (Following Ovulation): As soon as progesterone becomes dominant, BBT continues to rise. When pregnancy fails to occur, progesterone levels fall and temperature drops, indicating menstruation. When you conceive, the temperature continues to be high after 16 days at times, creating a triphasic trend, which can indicate an early pregnancy.
How to Monitor Your Basal Body Temperature
Monitoring your BBT needs patience, time, and energy. However, the habit becomes second nature with time.
Step-by-Step Method:
- Take your temperature at the same hour every morning before getting out of bed.
- Use a digital BBT thermometer with two-decimal accuracy (e.g., 97.45°F).
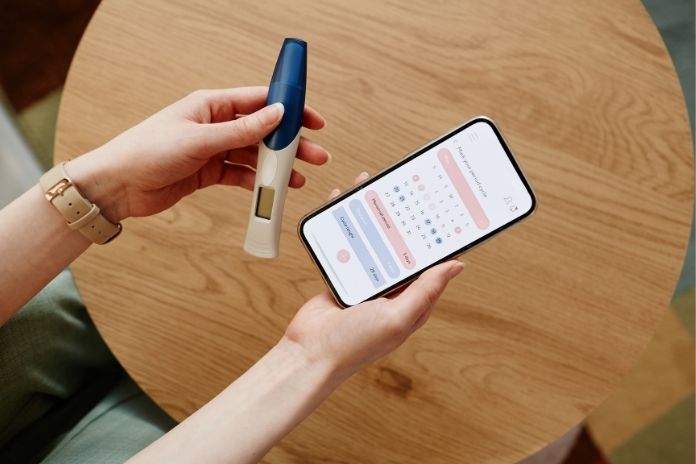
- Take readings in a paper chart or a fertility tracking app.
- Measure for a minimum of three cycles to see reliable patterns.
Best Practices for Accuracy:
- Have at least 3–4 hours of undisturbed sleep before measuring.
- Steer clear of alcohol or late nights, which can artificially inflate temperatures.
- Measure before eating, talking, or changing positions.
- Keep your thermometer next to your bed for consistency.
- New BBT apps streamline tracking, automatically charting, and projecting fertile windows.
Read More: Effective Ovulation Tracking: Top Tools and Methods for Conception
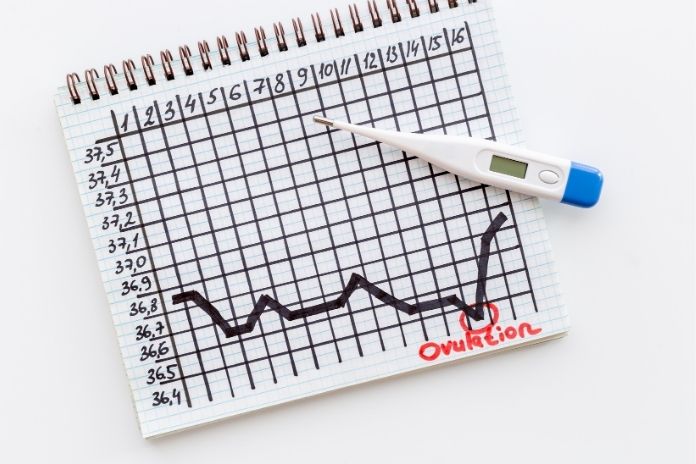
Making and Interpreting a BBT Chart
A BBT chart is more than digits; it’s a pictorial narrative of your cycle. Once you’ve recorded temperatures, here’s how you make and interpret a BBT chart:
What It Looks Like:
- The follicular phase has lower, flatter temperatures.
- The ovulation phase is characterised by a temperature dip, then a rapid rise.
- In the luteal phase, you have constant high temperatures.
Finding Patterns:
- Thermal shift is when there’s an increase of 4°F or greater maintained for 3+ days.
- A triphasic BBT chart, which has three distinct phases, is sometimes associated with early pregnancy.
- A monophasic chart is characterised by no rise in temperature, indicating anovulation, that is absence of ovulation in that cycle.
How Long to Track:
3–6 months of regular BBT charting is recommended by most experts to determine precise cycle patterns.
How BBT Helps You Know When You’re Fertile

Even though BBT only verifies ovulation after it has taken place, it also offers useful information:
- Identifying Ovulation: By determining the day ovulation occurred, you can better plan for intercourse in subsequent cycles.
- Estimating the Fertile Window: The fertile window is the five days leading up to and including ovulation. By reviewing and understanding previous cycles, you can expect when this window will come up.
- Blending Methods: Combining BBT with mucus observations is more accurate because the mucus shows up ahead of the temperature shift.
This double tracking is the basis of the fertility awareness method, which can help with conception as well as natural family planning.
“Consistency is key” when it comes to tracking BBT, says Lindsay Kroener, M.D., assistant clinical professor in reproductive endocrinology and infertility at the University of California, Los Angeles. “When BBT temperature tracking is done, accurate results are dependent on very consistent measurements every day,” Dr. Kroener says.
BBT Charting Limitations
For all its value, BBT has some limitations that have to be considered:
- BBT charting confirms ovulation. Unlike Ovulation Predictor Kits, BBT indicates ovulation after it has already occurred.
- It is affected by external influences such as fever, stress, alcohol, late nights, or irregular sleep cycles. These can lead to false readings of BBT.
- Incorrect patterns could be an issue in case of irregularity in cycles. PCOS, thyroid, or irregularly menstruating women may have difficulty detecting obvious patterns.
- BBT charting needs consistency. Skipping days or taking measurements at varied times decreases accuracy.
So, although BBT fertility tracking is strong, it needs to be used with other fertility tools for the best results.
Read More: Luteal Phase Defect: A Hidden Reason for Repeated Miscarriages
Blending BBT With Other Fertility Monitoring Methods
For added accuracy, most women combine BBT charting with others:
- Observations of cervical mucus are essential. For example, egg-white-like consistency indicates high fertility. There are higher chances of conceiving during this phase.
- Ovulation predictor kits (OPKs)help detect the luteinizing hormone (LH) surge 24–36 hours before ovulation.
- Calendar tracking detects the regularity of the cycle and calculates fertile days.
- Fertility apps and wearables integrate BBT, mucus, and OPK information, while wearables monitor temperature throughout the night.
Adopting a multi-method strategy makes it easier to predict ovulation in advance, rather than confirming it later.
When to See a Doctor or Fertility Specialist

BBT charting may also identify problems that require medical assessment:
- Irregular or uncertain charts, even with correct tracking for many cycles.
- No visible ovulation, which might be an indication of anovulation.
- Unpredictable luteal phase lengths signal a potential luteal phase defect or progesterone imbalance.
- Failure to conceive after 6–12 months of properly timed efforts.
In such situations, a fertility specialist may advise hormone testing, ultrasound monitoring, or other advanced fertility treatments.
Tips for Success and Next Steps
BBT charting can be a boon for couples trying to conceive. You can optimize your success rate with these tips:
- Chart for a minimum of 3–6 months before concluding.
- Improve fertility naturally with a balanced diet, stress management, and sufficient sleep.
- Limit alcohol, smoking, and excessive caffeine, which can disrupt fertility.
- Show your BBT charts to a healthcare provider for expert advice
- Using fertility wearables and apps makes monitoring easy and prevents human error.
Keep in mind that BBT is more than numbers; it’s a clear understanding of your cycle and reproductive health.
Conclusion
Basal body temperature (BBT) charting is a low-cost, easy, and informative method to grasp your fertility. With close monitoring of temperature changes, you can verify ovulation, detect fertile periods, and even identify potential early signs of pregnancy.
Though limited and best used consistently, when paired with other methods of fertility awareness, BBT is an incredible tool for conception and natural family planning.
References
- https://www.ncbi.nlm.nih.gov/books/NBK546686/
- https://www.naturalcycles.com/cyclematters/what-is-basal-body-temperature
- https://flo.health/getting-pregnant/trying-to-conceive/tracking-ovulation/ovulation-tests
- https://naturalfamilyplanningireland.ie/basal-body-temperature-bbt/temperature-graph-info/
- https://www.sciencedirect.com/topics/medicine-and-dentistry/ovulation-prediction
- https://www.ferty9.com/blog/triphasic-bbt-chart-causes-triphasic-temperature-shifts
- https://www.draravindsivf.com/blogs/basal-temperature-fertility-tracking
In this Article